12/2/23

AI - A Learning Based Approach For Predicting Heart Disease

Abstract

Heart disease is a leading cause of mortality worldwide, and its early identification and risk assessment are critical for effective prevention and intervention. With the help of electronic health records (EHR) and a wealth of health-related data, there is a significant opportunity to leverage machine learning techniques for predicting and assessing the risk of heart disease in individuals.

ozkary-ai-engineering-heart-disease

The United States Centers for Disease Control and Prevention (CDC) has been collecting a vast array of data on demographics, lifestyle, medical history, and clinical parameters. This data repository offers a valuable resource to develop predictive models that can help identify those at risk of heart disease before symptoms manifest.

This study aims to use machine learning models to predict an individual's likelihood of developing heart disease based on CDC data. By employing advanced algorithms and data analysis, we seek to create a predictive model that factors in various attributes such as age, gender, cholesterol levels, blood pressure, smoking habits, and other relevant health indicators. The solution could assist healthcare professionals in evaluating an individual's risk profile for heart disease.

Key Objectives

Key objectives of this study include:

  1. Developing a robust machine learning model capable of accurately predicting the risk of heart disease using CDC data.
  2. Identifying the most influential risk factors and parameters contributing to heart disease prediction.
  3. Compare model performance:
    • Logistic Regression
    • Decision Tree
    • Random Forest
    • XGBoost Classification
  4. Evaluating the following metrics
    • Accuracy
    • Precision,
    • F1
    • Recall
  5. Providing an API, so tools can integrate and make a risk analysis.
    • Build a local app
    • Build an Azure function for cloud deployment

The successful implementation of this study will lead to a transformative impact on public health by enabling timely preventive measures and tailored interventions for individuals at risk of heart disease.

Conclusion

This study was conducted by using four different Machine Learning algorithm. After comparing the performance of all these models, we concluded that the XGBoost Model has a relatively balanced precision and recall metrics, indicating that it's better at identifying true positives while keeping false positives in check. Based on this analysis, we choose XGBoost as the best performing model for this type of analysis.

Machine Learning Engineering Process

In order to execute this project, we follow a series of steps for discovery and data analysis, data processing and model selection. This process is done using jupyter notebooks for the experimental phase, and python files for the implementation and delivery phase.

Experimental Phase Notebooks

👉 The data files for this study can be found in the same GitHub project as the Jupyter Notebook files.

Data Analysis - Exploratory Data Analysis (EDA)

These are the steps to analysis the data:

  • Load the data/2020/heart_2020_cleaned.csv
  • Fill in the missing values with zero
  • Review the data
    • Rename the columns to lowercase
    • Check the data types
    • Preview the data
  • Identify the features
    • Identify the categorical and numeric features
    • Identify the target variables
  • Remove duplicates
  • Identify categorical features that can be converted into binary
  • Check the class balance in the data
    • Check for Y/N labels for heart disease identification

Features

Based on the dataset, we have a mix of categorical and numerical features. We consider the following for encoding:

  1. Categorical Features:

    • 'heartdisease': This is the target variable. We remove this feature for the model training.
    • 'smoking', 'alcoholdrinking', 'stroke', 'sex', 'agecategory', 'race', 'diabetic', 'physicalactivity', 'genhealth', 'sleeptime', 'asthma', 'kidneydisease', 'skincancer': These are categorical features. We can consider one-hot encoding these features.
  2. Numerical Features:

    • 'bmi', 'physicalhealth', 'mentalhealth', 'diffwalking': These are already numerical features, so there's no need to encode them.
# get a list of numeric features
features_numeric = list(df.select_dtypes(include=[np.number]).columns)

# get a list of object features and exclude the target feature 'heartdisease'
features_category = list(df.select_dtypes(include=['object']).columns)

# remove the target feature from the list of categorical features
target = 'heartdisease'

features_category.remove(target)

print('Categorical features',features_category)
print('Numerical features',features_numeric)

Data Validation and Class Balance

The data shows imbalance for the Y/N classes. There are less cases of heart disease, as expected, than the rest of the population. This can result in low performing models as there is way more negatives cases (N). To account for that, we can use techniques like down sampling the negative cases.

Heart Disease Distribution

# plot a distribution of the target variable set labels for each bar chart and show the count
print(df[target].value_counts(normalize=True).round(2))

# plot the distribution of the target variable
df[target].value_counts().plot(kind='bar', rot=0)
plt.xlabel('Heart disease')
plt.ylabel('Count')
# add a count label to each bar
for i, count in enumerate(df[target].value_counts()):
    plt.text(i, count-50, count, ha='center', va='top', fontweight='bold')

plt.show()

# # get the percentage of people with heart disease on a pie chart
df[target].value_counts(normalize=True).plot(kind='pie', labels=['No heart disease', 'Heart disease'], autopct='%1.1f%%', startangle=90)
plt.ylabel('')
plt.show()

👉 No 91% Yes 9%
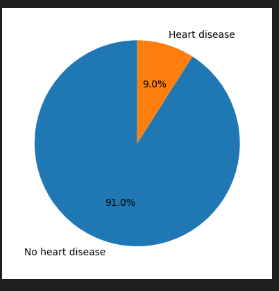
Heart Disease Class Balance

Data Processing

For data processing, we should follow these steps:

  • Load the data/2020/heart_2020_eda.csv
  • Process the values
    • Convert Yes/No features to binary (1/0)
    • Cast all the numeric values to int to avoid float problems
  • Process the features
    • Set the categorical features names
    • Set the numeric features names
    • Set the target variable
  • Feature importance analysis
    • Use statistical analysis to get the metrics like risk and ratio
    • Mutual Information score

Feature Analysis

The purpose of feature analysis in heart disease study is to uncover the relationships and associations between various patient characteristics (features) and the occurrence of heart disease. By examining factors such as lifestyle, medical history, demographics, and more, we aim to identify which specific attributes or combinations of attributes are most strongly correlated with heart disease. Feature analysis allows for the discovery of risk factors and insights that can inform prevention and early detection strategies.

# Calculate the mean and count of heart disease occurrences per feature value
feature_importance = []

# Create a dataframe for the analysis
results = pd.DataFrame(columns=['Feature', 'Value', 'Percentage'])

for feature in all_features:    
    grouped = df.groupby(feature)[target].mean().reset_index()
    grouped.columns = ['Value', 'Percentage']
    grouped['Feature'] = feature
    results = pd.concat([results, grouped], axis=0)

# Sort the results by percentage in descending order and get the top 10
results = results.sort_values(by='Percentage', ascending=False).head(15)

# get the overall heart diease occurrence rate
overall_rate = df[target].mean()
print('Overall Rate',overall_rate)

# calculate the difference between the feature value percentage and the overall rate
results['Difference'] = results['Percentage'] - overall_rate

# calculate the ratio of the difference to the overall rate
results['Ratio'] = results['Difference'] / overall_rate

# calculate the risk of heart disease occurrence for each feature value
results['Risk'] = results['Percentage'] / overall_rate

# sort the results by ratio in descending order
results = results.sort_values(by='Risk', ascending=False)

print(results)

# Visualize the rankings (e.g., create a bar plot)
import matplotlib.pyplot as plt
import seaborn as sns

plt.figure(figsize=(12, 6))
sns.barplot(data=results, x='Percentage', y='Value', hue='Feature')
plt.xlabel('Percentage of Heart Disease Occurrences')
plt.ylabel('Feature Value')
plt.title('Top 15 Ranking of Feature Values by Heart Disease Occurrence')
plt.show()

Overall Rate 0.09035
           Feature Value  Percentage  Difference     Ratio      Risk
65             bmi    77    0.400000    0.309647  3.427086  4.427086
1           stroke     1    0.363810    0.273457  3.026542  4.026542
3        genhealth  Poor    0.341131    0.250778  2.775537  3.775537
68             bmi    80    0.333333    0.242980  2.689239  3.689239
18       sleeptime    19    0.333333    0.242980  2.689239  3.689239
71             bmi    83    0.333333    0.242980  2.689239  3.689239
21       sleeptime    22    0.333333    0.242980  2.689239  3.689239
1    kidneydisease     1    0.293308    0.202956  2.246254  3.246254
29  physicalhealth    29    0.289216    0.198863  2.200957  3.200957
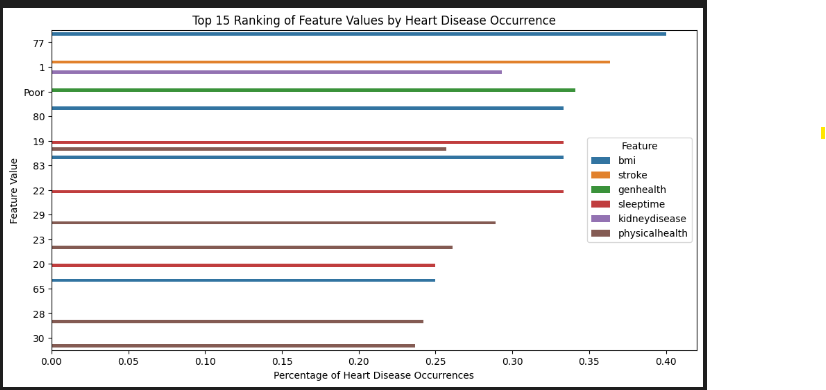
Heart Disease Feature Importance

  1. Overall Rate: This is the overall rate of heart disease occurrence in the dataset. It represents the proportion of individuals with heart disease (target='Yes') in the dataset. For example, if the overall rate is 0.2, it means that 20% of the individuals in the dataset have heart disease.

  2. Difference: This value represents the difference between the percentage of heart disease occurrence for a specific feature value and the overall rate. It tells us how much more or less likely individuals with a particular feature value are to have heart disease compared to the overall population. A positive difference indicates a higher likelihood, while a negative difference indicates a lower likelihood.

  3. Ratio: The ratio represents the difference relative to the overall rate. It quantifies how much the heart disease occurrence for a specific feature value deviates from the overall rate, considering the overall rate as the baseline. A ratio greater than 1 indicates a higher risk compared to the overall population, while a ratio less than 1 indicates a lower risk.

  4. Risk: This metric directly quantifies the likelihood of an event happening for a specific feature value, expressed as a percentage. It's easier to interpret as it directly answers the question: "What is the likelihood of heart disease for individuals with this feature value?"

These values help us understand the relationship between different features and heart disease. Positive differences, ratios greater than 1, and risk values greater than 100% suggest a higher risk associated with a particular feature value, while negative differences, ratios less than 1, and risk values less than 100% suggest a lower risk. This information can be used to identify factors that may increase or decrease the risk of heart disease within the dataset.

Mutual Information Score

The mutual information score measures the dependency between a feature and the target variable. Higher scores indicate stronger dependency, while lower scores indicate weaker dependency. A higher score suggests that the feature is more informative when predicting the target variable.

# Compute mutual information scores for each feature
X = df[cat_features]
y = df[target]

def mutual_info_heart_disease_score(series):
    return mutual_info_score(series, y)

mi_scores = X.apply(mutual_info_heart_disease_score)
mi_ranking = pd.Series(mi_scores, index=X.columns).sort_values(ascending=False)

print(mi_ranking)
# Visualize the rankings
plt.figure(figsize=(12, 6))
sns.barplot(x=mi_ranking.values, y=mi_ranking.index)
plt.xlabel('Mutual Information Scores')
plt.ylabel('Feature')
plt.title('Feature Importance Ranking via Mutual Information Scores')
agecategory    0.033523
genhealth      0.027151
diabetic       0.012960
sex            0.002771
race           0.001976
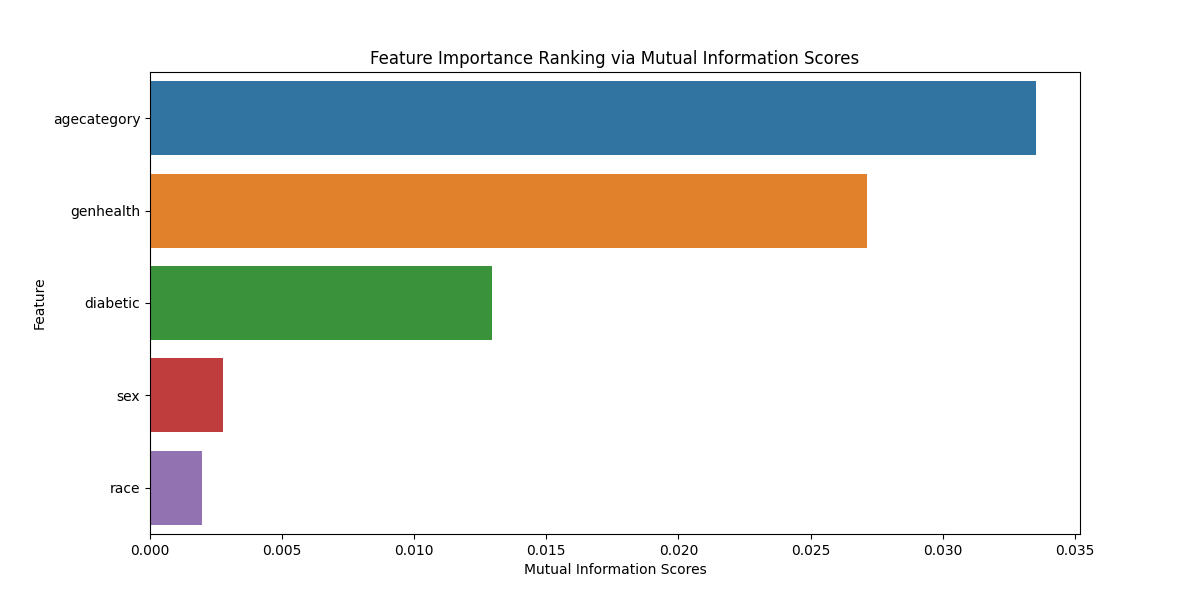
Heart Disease Feature Importance

Machine Learning Training and Model Selection

  • Load the data/2020/heart_2020_processed.csv
  • Process the features
    • Set the categorical features names
    • Set the numeric features names
    • Set the target variable
  • Split the data
    • train/validation/test split with 60%/20%/20% distribution.
    • Random_state 42
    • Use strategy = y to deal with the class imbalanced problem
  • Train the model
    • LogisticRegression
    • RandomForestClassifier
    • XGBClassifier
    • DecisionTreeClassifier
  • Evaluate the models and compare them
    • accuracy_score
    • precision_score
    • recall_score
    • f1_score
  • Confusion Matrix

Data Split

  • Use a 60/20/20 distribution fir train/val/test
  • Random_state 42 to shuffle the data
  • Use strategy = y when there is a class imbalance in the dataset. It helps ensure that the class distribution in both the training and validation (or test) sets closely resembles the original dataset's class distribution
def split_data(self, test_size=0.2, random_state=42):
        """
        Split the data into training and validation sets
        """
        # split the data in train/val/test sets, with 60%/20%/20% distribution with seed 1
        X = self.df[self.all_features]
        y = self.df[self.target_variable]
        X_full_train, X_test, y_full_train, y_test = train_test_split(X, y, test_size=test_size, random_state=random_state, stratify=y)

        # .25 splits the 80% train into 60% train and 20% val
        X_train, X_val, y_train, y_val  = train_test_split(X_full_train, y_full_train, test_size=0.25, random_state=random_state)

        X_train = X_train.reset_index(drop=True)
        X_val = X_val.reset_index(drop=True)
        y_train = y_train.reset_index(drop=True)
        y_val = y_val.reset_index(drop=True)
        X_test = X_test.reset_index(drop=True)
        y_test = y_test.reset_index(drop=True)

        # print the shape of all the data splits
        print('X_train shape', X_train.shape)
        print('X_val shape', X_val.shape)
        print('X_test shape', X_test.shape)
        print('y_train shape', y_train.shape)
        print('y_val shape', y_val.shape)
        print('y_test shape', y_test.shape)

        return X_train, X_val, y_train, y_val, X_test, y_test

X_train, X_val, y_train, y_val, X_test, y_test = train_data.split_data(test_size=0.2, random_state=42)

The split_data call is a method that splits a dataset into training, validation, and test sets. Here's a breakdown of the returned values:

  • X_train: This represents the features (input variables) of the training set. The model will be trained on this data.

  • y_train: This corresponds to the labels (output variable) for the training set. It contains the correct outcomes corresponding to the features in X_train.

  • X_val: These are the features of the validation set. The model's performance is often assessed on this set during training to ensure it generalizes well to new, unseen data.

  • y_val: These are the labels for the validation set. They serve as the correct outcomes for the features in X_val during the evaluation of the model's performance.

  • X_test: These are the features of the test set. The model's final evaluation is typically done on this set to assess its performance on completely unseen data.

  • y_test: Similar to y_val, this contains the labels for the test set. It represents the correct outcomes for the features in X_test during the final evaluation of the model.

Model Training

For model training, we first pre-process the data by taking these steps:

  • preprocess_data
    • The input features X are converted to a dictionary format using the to_dict method with the orientation set to records. This is a common step when working with scikit-learn transformers, as they often expect input data in this format.
    • If is_training is True, it fits a transformer (self.encoder) on the data using the fit_transform method. If False, it transforms the data using the previously fitted transformer (self.encoder.transform). The standardized features are then returned.

We then train the different models:

  • train -This method takes X_train (training features) and y_train (training labels) as parameters. -If the models attribute of the class is None, it initializes a dictionary of machine learning models including logistic regression, random forest, XGBoost, and decision tree classifiers.
def preprocess_data(self, X, is_training=True):      
        """
        Preprocess the data for training or validation
        """  
        X_dict = X.to_dict(orient='records')        

        if is_training:
            X_std = self.encoder.fit_transform(X_dict)            
        else:
            X_std = self.encoder.transform(X_dict)

        # Return the standardized features and target variable
        return X_std

def train(self, X_train, y_train):

      if self.models is None:
          self.models = {
              'logistic_regression': LogisticRegression(C=10, max_iter=1000, random_state=42),
              'random_forest': RandomForestClassifier(n_estimators=100, max_depth=5, random_state=42, n_jobs=-1),
              'xgboost': XGBClassifier(n_estimators=100, max_depth=5, random_state=42, n_jobs=-1),                
              'decision_tree': DecisionTreeClassifier(max_depth=5, random_state=42)
          }

      for model in self.models.keys():
          print('Training model', model)
          self.models[model].fit(X_train, y_train) 

# hot encode the categorical features for the train data
model_factory = HeartDiseaseModelFactory(cat_features, num_features)
X_train_std = model_factory.preprocess_data(X_train[cat_features + num_features], True)

# hot encode the categorical features for the validation data
X_val_std = model_factory.preprocess_data(X_val[cat_features + num_features], False)

# Train the model
model_factory.train(X_train_std, y_train)

Model Evaluation

For the model evaluation, we calculate the following metrics:

  1. Accuracy tells us how often your model is correct. It's the percentage of all predictions that are accurate. For example, an accuracy of 92% is great, while 70% is not good.

  2. Precision is about being precise, not making many mistakes. It's the percentage of positive predictions that were actually correct. For instance, a precision of 90% is great, while 50% is not good.

  3. Recall is about not missing any positive instances. It's the percentage of actual positives that were correctly predicted. A recall of 85% is great, while 30% is not good.

  4. F1 Score is a balance between precision and recall. It's like having the best of both worlds. For example, an F1 score of 80% is great, while 45% is not good.


def evaluate(self, X_val, y_val, threshold=0.5):
        """
        Evaluate the model on the validation data set and return the predictions
        """

        # create a dataframe to store the metrics
        df_metrics = pd.DataFrame(columns=['model', 'accuracy', 'precision', 'recall', 'f1', 'y_pred'])

        # define the metrics to be calculated
        fn_metrics = { 'accuracy': accuracy_score,'precision': precision_score,'recall': recall_score,'f1': f1_score}

        # loop through the models and get its metrics
        for model_name in self.models.keys():

            model = self.models[model_name]

            # The first column (y_pred_proba[:, 0]) is for class 0 ("N")
            # The second column (y_pred_proba[:, 1]) is for class 1 ("Y")            
            y_pred = model.predict_proba(X_val)[:,1]
            # get the binary predictions
            y_pred_binary = np.where(y_pred > threshold, 1, 0)

            # add a new row to the dataframe for each model            
            df_metrics.loc[len(df_metrics)] = [model_name, 0, 0, 0, 0, y_pred_binary]

            # get the row index
            row_index = len(df_metrics)-1

            # Evaluate the model metrics
            for metric in fn_metrics.keys():
                score = fn_metrics[metric](y_val, y_pred_binary)
                df_metrics.at[row_index,metric] = score

        return df_metrics

Model Performance Metrics:

Model Accuracy Precision Recall F1
Logistic Regression 0.9097 0.509 0.0987 0.1654
Random Forest 0.9095 0.6957 0.0029 0.0058
XGBoost 0.9099 0.5154 0.098 0.1647
Decision Tree 0.9097 0.5197 0.0556 0.1004

These metrics provide insights into the performance of each model, helping us understand their strengths and areas for improvement.

Analysis:

  • XGBoost Model:

    • Accuracy: 90.99
    • Precision: 51.54%
    • Recall: 9.80%
    • F1 Score: 16.47%
  • Decision Tree Model:

    • Accuracy: 90.97%
    • Precision: 51.97%
    • Recall: 5.56%
    • F1 Score: 10.04%
  • Logistic Regression Model:

    • Accuracy: 90.97%
    • Precision: 50.90%
    • Recall: 9.87%
    • F1 Score: 16.54%
  • Random Forest Model:

    • Accuracy: 90.95%
    • Precision: 69.57%
    • Recall: 0.29%
    • F1 Score: 0.58%
  • XGBoost Model has a relatively balanced precision and recall, indicating it's better at identifying true positives while keeping false positives in check.

  • Decision Tree Model has the lowest recall, suggesting that it may miss some positive cases.

  • Logistic Regression Model has a good balance of precision and recall similar to the XGBoost Model.

  • Random Forest Model has high precision but an extremely low recall, meaning it's cautious in predicting positive cases but may miss many of them.

Based on this analysis, we will choose XGBoost as our API model
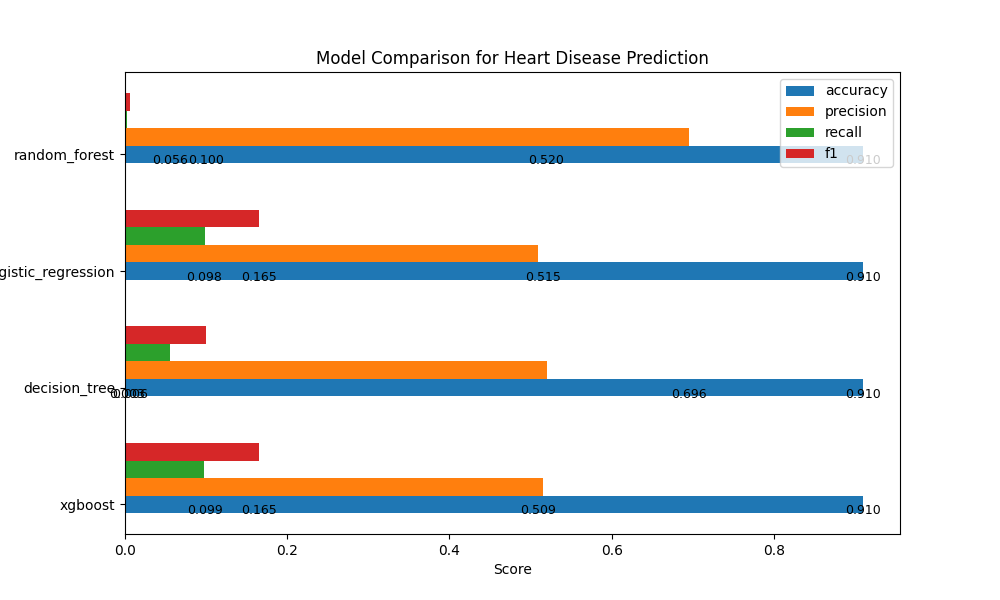
Heart Disease Model Evaluation

Confusion Matrix:

The confusion matrix is a valuable tool for evaluating the performance of classification models, especially for a binary classification problem like predicting heart disease (where the target variable has two classes: 0 for "No" and 1 for "Yes"). Let's analyze what the confusion matrix represents for heart disease prediction using the four models.

For this analysis, we'll consider the following terms:

  • True Positives (TP): The model correctly predicted "Yes" (heart disease) when the actual label was also "Yes."

  • True Negatives (TN): The model correctly predicted "No" (no heart disease) when the actual label was also "No."

  • False Positives (FP): The model incorrectly predicted "Yes" when the actual label was "No." (Type I error)

  • False Negatives (FN): The model incorrectly predicted "No" when the actual label was "Yes." (Type II error)

from sklearn.metrics import confusion_matrix
import seaborn as sns
import matplotlib.pyplot as plt

cms = []
model_names = []
total_samples = []

for model_name in df_metrics['model']:
    model_y_pred = df_metrics[df_metrics['model'] == model_name]['y_pred'].iloc[0]

    # Compute the confusion matrix
    cm = confusion_matrix(y_val, model_y_pred)    
    cms.append(cm)
    model_names.append(model_name)
    total_samples.append(np.sum(cm))    

# Create a 2x2 grid of subplots
fig, axes = plt.subplots(2, 2, figsize=(10, 10))

# Loop through the subplots and plot the confusion matrices
for i, ax in enumerate(axes.flat):
    cm = cms[i]    
    im = ax.imshow(cm, interpolation='nearest', cmap=plt.cm.Blues)
    ax.figure.colorbar(im, ax=ax, shrink=0.6)

    # Set labels, title, and value in the center of the heatmap
    ax.set(xticks=np.arange(cm.shape[1]), yticks=np.arange(cm.shape[0]), 
           xticklabels=["No Heart Disease", "Heart Disease"], yticklabels=["No Heart Disease", "Heart Disease"],
           title=f'{model_names[i]} (n={total_samples[i]})\n')

    # Loop to annotate each quadrant with its count
    for i in range(cm.shape[0]):
        for j in range(cm.shape[1]):
            ax.text(j, i, str(cm[i, j]), ha="center", va="center", color="gray")

    ax.title.set_fontsize(12)
    ax.set_xlabel('Predicted', fontsize=10)
    ax.set_ylabel('Actual', fontsize=10)
    ax.xaxis.set_label_position('top')

# Adjust the layout
plt.tight_layout()

Let's examine the confusion matrices for each model:
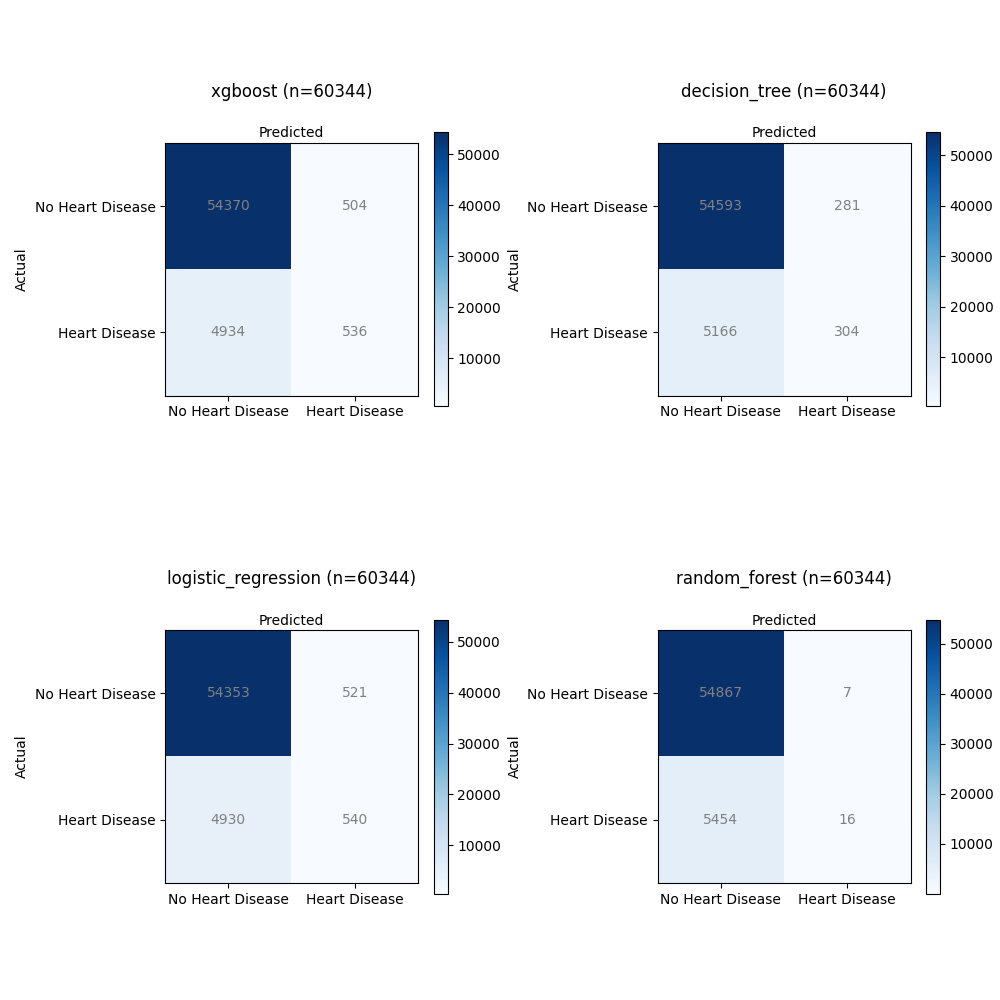
Heart Disease Model Confusion Matrix

  • XGBoost:

    • Total Samples: 60,344
    • Confusion Matrix Total:
      • True Positives (TP): 536
      • True Negatives (TN): 54,370
      • False Positives (FP): 504
      • False Negatives (FN): 4,934
  • Decision Tree:

    • Total Samples: 60,344
    • Confusion Matrix Total:
      • True Positives (TP): 304
      • True Negatives (TN): 54,593
      • False Positives (FP): 281
      • False Negatives (FN): 5,166
  • Logistic Regression:

    • Total Samples: 60,344
    • Confusion Matrix Total:
      • True Positives (TP): 540
      • True Negatives (TN): 54,353
      • False Positives (FP): 521
      • False Negatives (FN): 4,930
  • Random Forest:

    • Total Samples: 60,344
    • Confusion Matrix Total:
      • True Positives (TP): 16
      • True Negatives (TN): 54,867
      • False Positives (FP): 7
      • False Negatives (FN): 5,454

XGBoost:

  • This model achieved a relatively high number of True Positives (TP) with 536 cases correctly predicted as having heart disease.
  • It also had a significant number of True Negatives (TN), indicating correct predictions of no heart disease (54,370).
  • However, there were 504 False Positives (FP), where it incorrectly predicted heart disease.
  • It had 4,934 False Negatives (FN), suggesting instances where actual heart disease cases were incorrectly predicted as non-disease.

Decision Tree:

  • The Decision Tree model achieved 304 True Positives (TP), correctly identifying heart disease cases.
  • It also had 54,593 True Negatives (TN), showing accurate predictions of no heart disease.
  • There were 281 False Positives (FP), indicating instances where the model incorrectly predicted heart disease.
  • It had 5,166 False Negatives (FN), meaning it missed identifying heart disease in these cases.

Logistic Regression:

  • The Logistic Regression model achieved 540 True Positives (TP), correctly identifying cases with heart disease.
  • It had a high number of True Negatives (TN) with 54,353 correctly predicted non-disease cases.
  • However, there were 521 False Positives (FP), where the model incorrectly predicted heart disease.
  • It also had 4,930 False Negatives (FN), indicating missed predictions of heart disease.

Random Forest:

  • The Random Forest model achieved a relatively low number of True Positives (TP) with 16 cases correctly predicted as having heart disease.
  • It had a high number of True Negatives (TN) with 54,867 correctly predicted non-disease cases.
  • There were only 7 False Positives (FP), suggesting rare incorrect predictions of heart disease.
  • However, it also had 5,454 False Negatives (FN), indicating a substantial number of missed predictions of heart disease.

All models achieved a good number of True Negatives, suggesting their ability to correctly predict non-disease cases. However, there were variations in True Positives, False Positives, and False Negatives. The XGBoost model achieved the highest True Positives but also had a significant number of False Positives. The Decision Tree and Logistic Regression models showed similar TP and FP counts, while the Random Forest model had the lowest TP count. The trade-off between these metrics is essential for assessing the model's performance in detecting heart disease accurately.

Summary

In the quest to find the best solution for predicting heart disease, it's crucial to evaluate various models. However, it's not just about picking a model and hoping for the best. We need to be mindful of class imbalances – situations where one group has more examples than the other. This imbalance can throw our predictions off balance.

To fine-tune our models, we also need to adjust the hyperparameters. Think of it as finding the perfect settings to make our models have a better performance. By addressing class imbalances and tweaking those hyperparameters, we ensure our models perform accurately.

By using the correct data features and evaluating the performance of our models, we can build solutions that could assist healthcare professionals in evaluating an individual's risk profile for heart disease.

Thanks for reading.

Send question or comment at Twitter @ozkary Originally published by ozkary.com

11/29/23

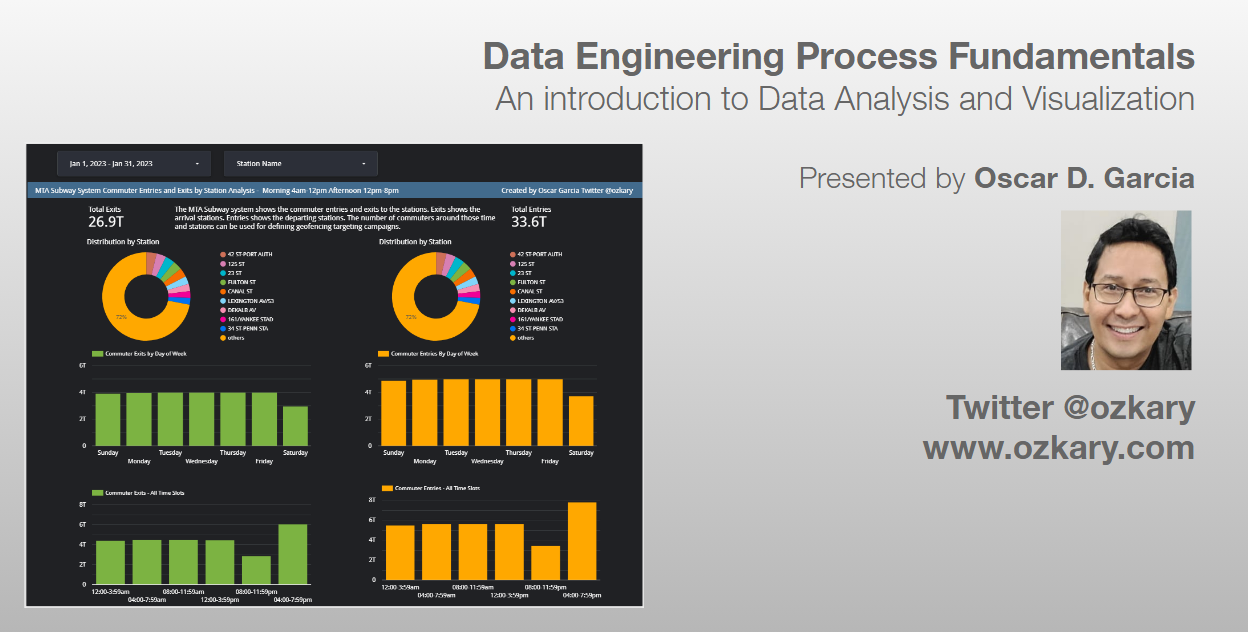
Data Engineering Process Fundamentals - An introduction to Data Analysis and Visualization

In this technical presentation, we will delve into the fundamental concepts of Data Engineering in the areas of data analysis and visualization. We focus on these areas by using both a code-centric and low-code approach.

  • Follow this GitHub repo during the presentation: (Give it a star)

https://github.com/ozkary/data-engineering-mta-turnstile

  • Read more information on my blog at:

https://www.ozkary.com/2023/03/data-engineering-process-fundamentals.html

Presentation

YouTube Video

Section 1: Data Analysis Essentials

Data Analysis: Explore the fundamentals of data analysis using Python, unraveling the capabilities of libraries such as Pandas and NumPy. Learn how Jupyter Notebooks provide an interactive environment for data exploration, analysis, and visualization.

Data Profiling: With Python at our fingertips, discover how Jupyter Notebooks aid in data profiling—understanding data structures, quality, and characteristics. Witness the seamless integration with tools like pandas-profiling for comprehensive data insights.

Cleaning and Preprocessing: Dive into the world of data cleaning and preprocessing with Python's Pandas library, facilitated by the user-friendly environment of Jupyter Notebooks. See how Visual Studio Code enhances the coding experience for efficient data preparation.

Section 2: Statistical Analysis vs. Business Intelligence

Statistical Analysis: Embrace Python's statistical libraries, such as SciPy and StatsModels, within the Jupyter environment. Witness the power of statistical analysis for extracting patterns and correlations from data, all seamlessly integrated into your workflow with Visual Studio Code.

Business Intelligence: Contrast statistical analysis with the broader field of business intelligence, emphasizing the role of Python in data transformation. Utilize Jupyter Notebooks to showcase how Python's versatility extends to business intelligence applications.

Section 3: The Power of Data Visualization

Importance of Data Visualization: Unlock the potential of Python's visualization libraries, such as Matplotlib and Seaborn, within the interactive canvas of Jupyter Notebooks. Visual Studio Code complements this process, providing a robust coding environment for creating captivating visualizations.

Introduction to Tools: While exploring the importance of data visualization, let's talk about the powerful visualization tools like Power BI, Looker, and Tableau. Learn how this integration elevates your data storytelling capabilities.

Conclusion:

This session aims to equip attendees with a strong foundation in data engineering, focusing on the pivotal role of data analysis and visualization. By the end of this presentation, participants will grasp how to effectively utilize these practices, so they are able to start the journey on data analysis and visualization.

This presentation will be accompanied by live code demonstrations and interactive discussions, ensuring attendees gain practical knowledge and valuable insights into the dynamic world of data engineering.

Some of the technologies that we will be covering:

  • Data Analysis
  • Data Visualization
  • Python
  • Jupyter Notebook
  • Looker

Thanks for reading.

Send question or comment at Twitter @ozkary Originally published by ozkary.com
10/25/23

Data Engineering Process Fundamentals - Unveiling the Power of Data Lakes and Data Warehouses


In this technical presentation, we will delve into the fundamental concepts of Data Engineering, focusing on two pivotal components of modern data architecture - Data Lakes and Data Warehouses. We will explore their roles, differences, and how they collectively empower organizations to harness the true potential of their data.

- Follow this GitHub repo during the presentation: (Give it a star)


- Read more information on my blog at:


Presentation


YouTube Video


1. Introduction to Data Engineering:
- Brief overview of the data engineering landscape and its critical role in modern data-driven organizations.

2. Understanding Data Lakes:
- Explanation of what a data lake is and its purpose in storing vast amounts of raw and unstructured data.

3. Exploring Data Warehouses:
- Definition of data warehouses and their role in storing structured, processed, and business-ready data.

4. Comparing Data Lakes and Data Warehouses:
- Comparative analysis of data lakes and data warehouses, highlighting their strengths and weaknesses.
- Discussing when to use each based on specific use cases and business needs.

5. Integration and Data Pipelines:
- Insight into the seamless integration of data lakes and data warehouses within a data engineering pipeline.
- Code walkthrough showcasing data movement and transformation between these two crucial components.

6. Real-world Use Cases:
- Presentation of real-world use cases where effective use of data lakes and data warehouses led to actionable insights and business success.
- Hands-on demonstration using Python, Jupyter Notebook and SQL to solidify the concepts discussed, providing attendees with practical insights and skills.


Conclusion:

This session aims to equip attendees with a strong foundation in data engineering, focusing on the pivotal role of data lakes and data warehouses. By the end of this presentation, participants will grasp how to effectively utilize these tools, enabling them to design efficient data solutions and drive informed business decisions.

This presentation will be accompanied by live code demonstrations and interactive discussions, ensuring attendees gain practical knowledge and valuable insights into the dynamic world of data engineering.

Some of the technologies that we will be covering:

- Data Lakes
- Data Warehouse
- Data Analysis and Visualization
- Python
- Jupyter Notebook
- SQL

Send question or comment at Twitter @ozkary

Originally published by ozkary.com

10/15/23

AI with Python and Tensorflow - Convolutional Neural Networks Analysis

Convolutional neural network (CNN)

Convolutional Neural Networks (CNNs) have revolutionized the field of computer vision and image processing. These specialized deep learning models are inspired by the human visual system and excel at tasks like image classification, object detection, and facial recognition.

CNNs employ convolution operations, primarily used for processing images. The network initiates the analysis by applying filters that aim to extract valuable image features using various convolutional kernels. Similar to other weights in the neural network, these filters can be enhanced by adjusting their kernels based on the output error. After this, the resultant images undergo pooling, followed by pixel-wise input to a standard neural network in a process known as flattening.

AI convolutional neural network - ozkary

Model 1

Input (IMG_WIDTH, IMG_HEIGHT, 3)
|
Conv2D (32 filters, 3x3 kernel, ReLU)
|
MaxPooling2D (2x2 pool size)
|
Flatten
|
Dense (128 nodes, ReLU)
|
Dropout (50%)
|
Dense (NUM_CATEGORIES, softmax)
|
Output (NUM_CATEGORIES)
  1. Input Layer (Conv2D):

    • Type: Convolutional Layer (2D)
    • Number of Filters: 32
    • Filter Size: (3, 3)
    • Activation Function: Rectified Linear Unit (ReLU)
    • Input Shape: (IMG_WIDTH, IMG_HEIGHT, 3) where 3 represents the color channels (RGB).
  2. Pooling Layer (MaxPooling2D):

    • Type: Max Pooling Layer (2D)
    • Pool Size: (2, 2)
    • Purpose: Reduces the spatial dimensions by taking the maximum value from each group of 2x2 pixels.
  3. Flatten Layer (Flatten):

    • Type: Flattening Layer
    • Purpose: Converts the multidimensional input into a 1D array to feed into the Dense layer.
  4. Dense Hidden Layer (Dense):

    • Number of Neurons: 128
    • Activation Function: ReLU
    • Purpose: Learns and represents complex patterns in the data.
  5. Dropout Layer (Dropout):

    • Rate: 0.5
    • Purpose: Helps prevent overfitting by randomly setting 50% of the inputs to zero during training.
  6. Output Layer (Dense):

    • Number of Neurons: NUM_CATEGORIES (Number of categories for traffic signs)
    • Activation Function: Softmax
    • Purpose: Produces probabilities for each category, summing to 1, indicating the likelihood of the input image belonging to each category.

layers = tf.keras.layers

# Create a convolutional neural network
model =  tf.keras.models.Sequential([

    # Convolutional layer. Learn 32 filters using a 3x3 kernel
    layers.Conv2D(32, (3, 3), activation='relu', input_shape=(30, 30, 3)),

    # Max-pooling layer, reduces the spatial dimensions by taking the maximum value from each group of 2x2 pixels
    layers.MaxPooling2D((2, 2)),

    # Converts the multidimensional input into a 1D array to feed into the Dense layer
    layers.Flatten(),

    # Dense Hidden Layer with 128 nodes and relu activation function to learns and represent complex patterns in the data
    layers.Dense(128, activation='relu'),

    # Dropout layer to prevent overfitting by randomly setting 50% of the inputs to 0 at each update during training
    layers.Dropout(0.5),

    # Output layer with NUM_CATEGORIES outputs and softmax activation function to return probability-like results
    layers.Dense(NUM_CATEGORIES, activation='softmax')
])

Model 2

Input (IMG_WIDTH, IMG_HEIGHT, 3)
|
Conv2D (32 filters, 3x3 kernel, ReLU)
|
MaxPooling2D (2x2 pool size)
|
Conv2D (64 filters, 3x3 kernel, ReLU)
|
MaxPooling2D (2x2 pool size)
|
Flatten
|
Dense (128 nodes, ReLU)
|
Dropout (50%)
|
Dense (NUM_CATEGORIES, softmax)
|
Output (NUM_CATEGORIES)
  1. Input Layer (Conv2D):

    • Type: Convolutional Layer (2D)
    • Number of Filters: 32
    • Filter Size: (3, 3)
    • Activation Function: Rectified Linear Unit (ReLU)
    • Input Shape: (IMG_WIDTH, IMG_HEIGHT, 3) where 3 represents the color channels (RGB).
  2. Pooling Layer (MaxPooling2D):

    • Type: Max Pooling Layer (2D)
    • Pool Size: (2, 2)
    • Purpose: Reduces the spatial dimensions by taking the maximum value from each group of 2x2 pixels.
  3. Convolutional Layer (Conv2D):

    • Number of Filters: 64
    • Filter Size: (3, 3)
    • Activation Function: ReLU
    • Purpose: Extracts higher-level features from the input.
  4. Pooling Layer (MaxPooling2D):

    • Pool Size: (2, 2)
    • Purpose: Further reduces spatial dimensions.
  5. Flatten Layer (Flatten):

    • Type: Flattening Layer
    • Purpose: Converts the multidimensional input into a 1D array to feed into the Dense layer.
  6. Dense Hidden Layer (Dense):

    • Number of Neurons: 128
    • Activation Function: ReLU
    • Purpose: Learns and represents complex patterns in the data.
  7. Dropout Layer (Dropout):

    • Rate: 0.5
    • Purpose: Helps prevent overfitting by randomly setting 50% of the inputs to zero during training.
  8. Output Layer (Dense):

    • Number of Neurons: NUM_CATEGORIES (Number of categories for traffic signs)
    • Activation Function: Softmax
    • Purpose: Produces probabilities for each category, summing to 1, indicating the likelihood of the input image belonging to each category.

layers = tf.keras.layers

    # Create a convolutional neural network
    model = tf.keras.models.Sequential([

        # Convolutional layer. Learn 32 filters using a 3x3 kernel
        layers.Conv2D(32, (3, 3), activation='relu', input_shape=(30, 30, 3)),

        # Max-pooling layer, reduces the spatial dimensions by taking the maximum value from each group of 2x2 pixels
        layers.MaxPooling2D((2, 2)),

        # Convolutional layer. Learn 64 filters using a 3x3 kernel to extracts higher-level features from the input
        layers.Conv2D(64, (3, 3), activation='relu'),

        # Max-pooling layer, using 2x2 pool size reduces spatial dimensions
        layers.MaxPooling2D((2, 2)),

        # Converts the multidimensional input into a 1D array to feed into the Dense layer
        layers.Flatten(),

        # Dense Hidden Layer with 128 nodes and relu activation function to learns and represent complex patterns in the data
        layers.Dense(128, activation='relu'),

        # Dropout layer to prevent overfitting by randomly setting 50% of the inputs to 0 at each update during training
        layers.Dropout(0.5),

        # Output layer with NUM_CATEGORIES outputs and softmax activation function to return probability-like results
        layers.Dense(NUM_CATEGORIES, activation='softmax')
    ])

The architecture follows a typical CNN pattern: alternating Convolutional and MaxPooling layers to extract features and reduce spatial dimensions, followed by Flattening and Dense layers for classification.

Feel free to adjust the number of filters, filter sizes, layer types, or other hyperparameters based on your specific problem and dataset. Experimentation is key to finding the best architecture for your task.

Model 1 Results

Images and Labels loaded 26640, 26640
Epoch 1/10
500/500 [==============================] - 7s 12ms/step - loss: 4.9111 - accuracy: 0.0545   
Epoch 2/10
500/500 [==============================] - 6s 12ms/step - loss: 3.5918 - accuracy: 0.0555
Epoch 3/10
500/500 [==============================] - 6s 12ms/step - loss: 3.5411 - accuracy: 0.0565
Epoch 4/10
500/500 [==============================] - 6s 12ms/step - loss: 3.5190 - accuracy: 0.0577
Epoch 5/10
500/500 [==============================] - 6s 12ms/step - loss: 3.5088 - accuracy: 0.0565
Epoch 6/10
500/500 [==============================] - 6s 12ms/step - loss: 3.5041 - accuracy: 0.0577
Epoch 7/10
500/500 [==============================] - 6s 12ms/step - loss: 3.5019 - accuracy: 0.0577
Epoch 8/10
500/500 [==============================] - 6s 12ms/step - loss: 3.5008 - accuracy: 0.0577
Epoch 9/10
500/500 [==============================] - 6s 12ms/step - loss: 3.5002 - accuracy: 0.0577
Epoch 10/10
500/500 [==============================] - 6s 12ms/step - loss: 3.4999 - accuracy: 0.0577
333/333 - 1s - loss: 3.4964 - accuracy: 0.0541 - 1s/epoch - 4ms/step

Model 2 Results


Images and Labels loaded 26640, 26640
Epoch 1/10
500/500 [==============================] - 9s 15ms/step - loss: 4.0071 - accuracy: 0.1315
Epoch 2/10
500/500 [==============================] - 7s 14ms/step - loss: 2.0718 - accuracy: 0.3963
Epoch 3/10
500/500 [==============================] - 7s 15ms/step - loss: 1.4216 - accuracy: 0.5529
Epoch 4/10
500/500 [==============================] - 7s 14ms/step - loss: 1.0891 - accuracy: 0.6546
Epoch 5/10
500/500 [==============================] - 7s 14ms/step - loss: 0.8440 - accuracy: 0.7320
Epoch 6/10
500/500 [==============================] - 7s 14ms/step - loss: 0.6838 - accuracy: 0.7862
Epoch 7/10
500/500 [==============================] - 7s 14ms/step - loss: 0.5754 - accuracy: 0.8184
Epoch 8/10
500/500 [==============================] - 7s 14ms/step - loss: 0.5033 - accuracy: 0.8420
Epoch 9/10
500/500 [==============================] - 7s 14ms/step - loss: 0.4171 - accuracy: 0.8729
Epoch 10/10
500/500 [==============================] - 7s 15ms/step - loss: 0.3787 - accuracy: 0.8851
333/333 - 2s - loss: 0.1354 - accuracy: 0.9655 - 2s/epoch - 6ms/step
Model saved to cnn_model2.keras.

Summary

This is a summary of the CNN model experiments:

Model 1 had a loss of 3.4964 and an accuracy of 0.0541. This model had a simple architecture with few layers and filters, which may have limited its ability to learn complex features in the input images.

Model 2 had a loss of 0.1354 and an accuracy of 0.9655. This model had a more complex architecture with additional hidden layers, including a convolutional layer with 64 filters and an additional max pooling (2x2) layer. The addition of these layers likely helped the model learn more complex features in the input images, leading to a significant improvement in accuracy.

In particular, the addition of more convolutional layers with more filters can help the model learn more complex features in the input images, as each filter learns to detect a different pattern or feature in the input. However, it is important to balance the number of filters with the size of the input images and the complexity of the problem, as using too many filters can lead to overfitting and poor generalization to new data.

Overall, the results suggest that increasing the complexity of the model by adding more hidden layers can help improve its accuracy, but it is important to balance the complexity of the model with the size of the input images and the complexity of the problem to avoid overfitting.

Learning rate

  • A learning rate of .001 (default) provided optimal results - loss: 0.1354 - accuracy: 0.9655
  • A learning rate of .01 lower the accuracy and increase the loss loss: 3.4858 - accuracy: 0.0594

A learning rate of 0.01 is too high for our specific problem and dataset, which can cause the model to overshoot the optimal solution and fail to converge.


model.compile(optimizer=tf.keras.optimizers.Adam(learning_rate=0.01),
              loss='categorical_crossentropy',
              metrics=['accuracy'])

Thanks for reading.

Send question or comment at Twitter @ozkary

👍 Originally published by ozkary.com
9/9/23

Data Engineering Process Fundamentals - Data Streaming Exersise

Data Streaming - Exercise

Now that we've covered the concepts of data streaming, let's move forward with an actual coding exercise. During this exercise, we'll delve into building a Kafka message broker and a Spark consumer with the objective of having the Kafka message broker work as a data producer for our subway system information. The Spark consumer acts as a message aggregator and writes the results to our data lake. This allows the data modeling process to pick up the information and insert it into the data warehouse, providing seamless integration and reusing our already operational data pipeline.

Batch Process vs Data Stream

In a batch process data pipeline, we define a schedule to process the data from its source. With a data stream pipeline, there is no schedule as the data flows as soon as it is available from its source.

In the batch data download, the data is aggregated for periods of four hours. Since the data stream comes in more frequently, there is no four-hour aggregation. The data comes in as single transactions.

Data Stream Strategy

From our system requirements, we already have a data pipeline process that runs an incremental update process to import the data from the data lake into our data warehouse. This process already handles data transformation, mapping, and populates all the dimension tables and fact tables with the correct information.

Therefore, we want to follow the same pipeline process and utilize what already exists. To account for the fact that the data comes in as a single transaction, and we do not want to create single files, we want to implement an aggregation strategy on our data streaming pipeline. This enables us to define time windows for when to publish the data, whether it's 1 minute or 4 hours. It really depends on what fits the business requirements. The important thing here is to understand the technical capabilities and the strategy for the solution.

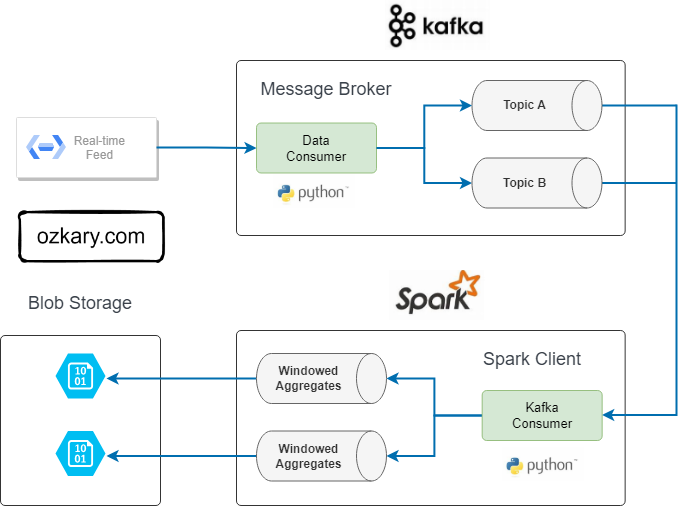
Data Streaming Data Flow Process

To deliver a data streaming solution, we typically employ a technical design illustrated as follows:

Data Engineering Process Fundamentals - Data Streaming Kafka Topics

  • Kafka

    • Producer
    • Topics
    • Consumer
  • Spark

    • Kafka Consumer
    • Message Parsing and Aggregations
    • Write to Data Lake or Other Storage

Kafka:

  • Producer: The producer is responsible for publishing data to Kafka topics. It produces and sends messages to specific topics, allowing data to be ingested into the Kafka cluster.
  • Topics: Topics are logical channels or categories to which messages are published by producers and from which messages are consumed by consumers. They act as data channels, providing a way to organize and categorize messages.
  • Consumer: Consumers subscribe to Kafka topics and process the messages produced by the producers. They play a vital role in real-time data consumption and are responsible for extracting valuable insights from the streaming data.

Spark:

  • Kafka Consumer: This component serves as a bridge between Kafka and Spark, allowing Spark to consume data directly from Kafka topics. It establishes a connection to Kafka, subscribes to specified topics, and pulls streaming data into Spark for further processing.

  • Message Parsing and Aggregations: Once data is consumed from Kafka, Spark performs message parsing to extract relevant information. Aggregations involve summarizing or transforming the data, making it suitable for analytics or downstream processing. This step is crucial for deriving meaningful insights from the streaming data.

  • Write to Data Lake or Other Storage: After processing and aggregating the data, Spark writes the results to a data lake or other storage systems. A data lake is a centralized repository that allows for the storage of raw and processed data in its native format. This step ensures that the valuable insights derived from the streaming data are persisted for further integration to a data warehouse.

Implementation Requirements

👉 Clone this repo or copy the files from this folder Streaming

For our example, we will adopt a code-centric approach and utilize Python to implement both our producer and consumer components. Additionally, we'll require instances of Apache Kafka and Apache Spark to be running. To ensure scalability, we'll deploy these components on separate virtual machines (VMs). Our Terraform scripts will be instrumental in creating new VM instances for this purpose. It's important to note that all these components will be encapsulated within Docker containers.

👉 For the ease of development in this lab, we can run everything on a single VM or local workstations. This allows us to bypass the complexities associated with network configuration. For real deployments, we should use separate VMs.

Requirements

👉 Before proceeding with the setup, ensure that the storage and Prefect credentials have been configured as shown on the Orchestration exercise step.

Docker

For running this locally or on virtual machines (VMs), the optimal approach is to leverage Docker Containers. In this exercise, we'll utilize a lightweight configuration of Kafka and Spark using Bitnami images. This configuration assumes a minimal setup with a Spark Master, a Spark Worker, and a Kafka broker.

Docker provides a platform for packaging, distributing, and running applications within containers. This ensures consistency across different environments and simplifies the deployment process. To get started, you can download and install Docker from the official website (https://www.docker.com/get-started). Once Docker is installed, the Docker command-line interface (docker) becomes available, enabling us to efficiently manage and interact with containers.

Docker Compose file

Utilize the docker-bitnami.compose.yaml file to configure a unified environment where both of these services should run. In the event that we need to run these services on distinct virtual machines (VMs), we would deploy each Docker image on a separate VM.

version: "3.6"
services:
  spark-master:
    image: bitnami/spark:latest
    container_name: spark-master
    environment:
      SPARK_MODE: "master"
    ports:
      - 8080:8080

  spark-worker:
    image: bitnami/spark:latest
    container_name: spark-worker
    environment:
      SPARK_MODE: "worker"
      SPARK_MASTER_URL: "spark://spark-master:7077"
    ports:
      - 8081:8081
    depends_on:
      - spark-master

  kafka:
    image: bitnami/kafka:latest
    container_name: kafka
    ports:
      - "9092:9092"
      - "29092:29092"  # Used for internal communication
    environment:
      KAFKA_LISTENER_SECURITY_PROTOCOL_MAP: PLAINTEXT:PLAINTEXT,PLAINTEXT_HOST:PLAINTEXT
      KAFKA_ADVERTISED_LISTENERS: PLAINTEXT://kafka:9092,PLAINTEXT_HOST://localhost:9092
      KAFKA_LISTENER_SECURITY_PROTOCOL_MAP: LISTENER_BOB:PLAINTEXT,LISTENER_FRED:PLAINTEXT
      KAFKA_LISTENERS: LISTENER_BOB://kafka:29092,LISTENER_FRED://kafka:9092
      KAFKA_ADVERTISED_LISTENERS: LISTENER_BOB://kafka:29092,LISTENER_FRED://localhost:9092
      KAFKA_INTER_BROKER_LISTENER_NAME: LISTENER_BOB
      KAFKA_OFFSETS_TOPIC_REPLICATION_FACTOR: 1
      KAFKA_GROUP_INITIAL_REBALANCE_DELAY_MS: 0
      KAFKA_TRANSACTION_STATE_LOG_MIN_ISR: 1
      KAFKA_TRANSACTION_STATE_LOG_REPLICATION_FACTOR: 1
    depends_on:
      - spark-master

Download the Docker Images

Before we proceed to run the Docker images, it's essential to download them in the target environment. To download the Bitnami images, you can execute the following script from a Bash command line:

$ bash download_images.sh
  • download_images.sh script

echo "Downloading Spark and Kafka Docker images..."

# Spark images from Bitnami
docker pull bitnami/spark:latest

# Kafka image from Bitnami
docker pull bitnami/kafka:latest

echo "Images downloaded successfully!"

# Display image sizes
echo "Image sizes:"
docker images bitnami/spark:latest bitnami/kafka:latest --format "{{.Repository}}:{{.Tag}} - {{.Size}}"

The download_images.sh script essentially retrieves two images from DockerHub. This script provides an automated way to download these images when creating new environments.

Start the Services

Once the Docker images are downloaded, initiate the services by executing the following script:

bash start_services.sh
  • start_services.sh script
#!/bin/bash

# Navigate to the Docker folder
cd docker

# Start Spark Master and Spark Worker
docker-compose up -f docker-compose-bitnami.yml -d spark-master spark-worker

# Wait for Spark Master and Worker to be ready (adjust sleep time as needed)
sleep 15

# Start Kafka and create Kafka topic
docker-compose up -d kafka

# Wait for Kafka to be ready (adjust sleep time as needed)
sleep 15

# Check if the Kafka topic exists before creating it
topic_exists=$(docker-compose exec kafka /opt/bitnami/kafka/bin/kafka-topics.sh --list --topic ozkary-topic --bootstrap-server localhost:9092 | grep "mta-turnstile")

if [ -z "$topic_exists" ]; then
  # Create Kafka topic
  docker-compose exec kafka /opt/bitnami/kafka/bin/kafka-topics.sh --create --topic mta-turnstile --partitions 1 --replication-factor 1 --bootstrap-server localhost:9092
  echo "Kafka topic created!"
else
  echo "Kafka topic already exists, no need to recreate."
fi

echo "Services started successfully!"

The start_services.sh script performs the following tasks:

  • Initiates Spark Master and Spark Worker services in detached mode (-d).
  • Launches Kafka service in detached mode.
  • Utilizes docker-compose exec to execute the Kafka topic creation command inside the Kafka container.

At this juncture, both services should be operational and ready to respond to client requests. Now, let's delve into implementing our applications.

Data Specifications

In this data streaming scenario, we are working with messages using a CSV data format with the following fields:

# Define the schema for the incoming data
turnstiles_schema = StructType([
    StructField("AC", StringType()),
    StructField("UNIT", StringType()),
    StructField("SCP", StringType()),
    StructField("STATION", StringType()),
    StructField("LINENAME", StringType()),
    StructField("DIVISION", StringType()),
    StructField("DATE", StringType()),
    StructField("TIME", StringType()),
    StructField("DESC", StringType()),
    StructField("ENTRIES", IntegerType()),
    StructField("EXITS", IntegerType()),
    StructField("ID", StringType()),
    StructField("TIMESTAMP", StringType())
])

The data format closely resembles what the source system provides for batch integration. However, in this scenario, we also have a unique ID and a TIMESTAMP.

As we process these messages, our objective is to generate files with data aggregation based on these fields:

"AC", "UNIT","SCP","STATION","LINENAME","DIVISION", "DATE", "DESC"

And these measures:

"ENTRIES", "EXITS"

An example of a message would look like this:

"A001,R001,02-00-00,Test-Station,456NQR,BMT,09-23-23,REGULAR,16:54:00,140,153"

It's important to note that the number of commuters is substantial, indicating a certain level of aggregation in these messages. However, they aren't aggregated every four hours, as the batch process does.

Once these message files are aggregated, they are then pushed to the data lake. Subsequently, our data warehouse process can pick them up and proceed with the necessary information processing.

Review the Code

To enable this functionality, we need to develop a Kafka producer and a Spark Kafka consumer, both implemented in Python. Let's begin by examining the fundamental features of the producer:

👉 Clone this repository or copy the files from this folder Streaming

Kafka Producer

The Kafka producer is a Python application designed to generate messages every 10 seconds. The produce_messages function utilizes messages from the provider and sends the serialized data to a Kafka topic.


class KafkaProducer:
    def __init__(self, config_path, topic):
        settings = read_config(config_path)
        self.producer = Producer(settings)
        self.topic = topic
        self.provider = Provider(topic)

    def delivery_report(self, err, msg):
        """
        Reports the success or failure of a message delivery.
        Args:
            err (KafkaError): The error that occurred on None on success.
            msg (Message): The message that was produced or failed.
        """
        if err is not None:
            print(f'Message delivery failed: {err}')
        else:
            print('Record {} produced to {} [{}] at offset {}'.format(msg.key(), msg.topic(), msg.partition(), msg.offset()))


    def produce_messages(self):
        while True:
            # Get the message key and value from the provider
            key, message = self.provider.message()

            try:

                # Produce the message to the Kafka topic
                self.producer.produce(topic = self.topic, key=key_serializer(key),
                                    value=value_serializer(message),
                                    on_delivery = self.delivery_report)

                # Flush to ensure delivery
                self.producer.flush()

                # Print the message
                print(f'Sent message: {message}')

                # Wait for 10 seconds before sending the next message
                time.sleep(10)
            except KeyboardInterrupt:
                pass
                exit(0)
            except KafkaTimeoutError as e:
                print(f"Kafka Timeout {e.__str__()}")
            except Exception as e:
                print(f"Exception while producing record - {key} {message}: {e}")
                continue

This class utilizes the Confluent Kafka library for seamless interaction with Kafka. It encapsulates the logic for producing messages to a Kafka topic, relying on external configurations, message providers, and serialization functions. The produce_messages method is crafted to run continuously until interrupted, while the delivery_report method serves as a callback function, reporting the success or failure of message delivery.

@flow (name="MTA Data Stream flow", description="Data Streaming Flow")
def main_flow(params) -> None:
    """
    Main flow to read and send the messages
    """    
    topic = params.topic    
    config_path = params.config    
    producer = KafkaProducer(config_path, topic)

    producer.produce_messages()

if __name__ == "__main__":

    """main entry point with argument parser"""
    os.system('clear')
    print('publisher running...')
    parser = argparse.ArgumentParser(description='Producer : --topic mta-turnstile --config path-to-config')

    parser.add_argument('--topic', required=True, help='stream topic')    
    parser.add_argument('--config', required=True, help='kafka setting') 

    args = parser.parse_args()

    # Register the signal handler to handle Ctrl-C       
    signal.signal(signal.SIGINT, lambda signal, frame: handle_sigint(signal, frame, producer.producer))

    main_flow(args)

    print('publisher end')

The main block acts as the entry point, featuring an argument parser that captures the topic and Kafka configuration path from the command line. The script then invokes the main_flow function with the provided arguments.

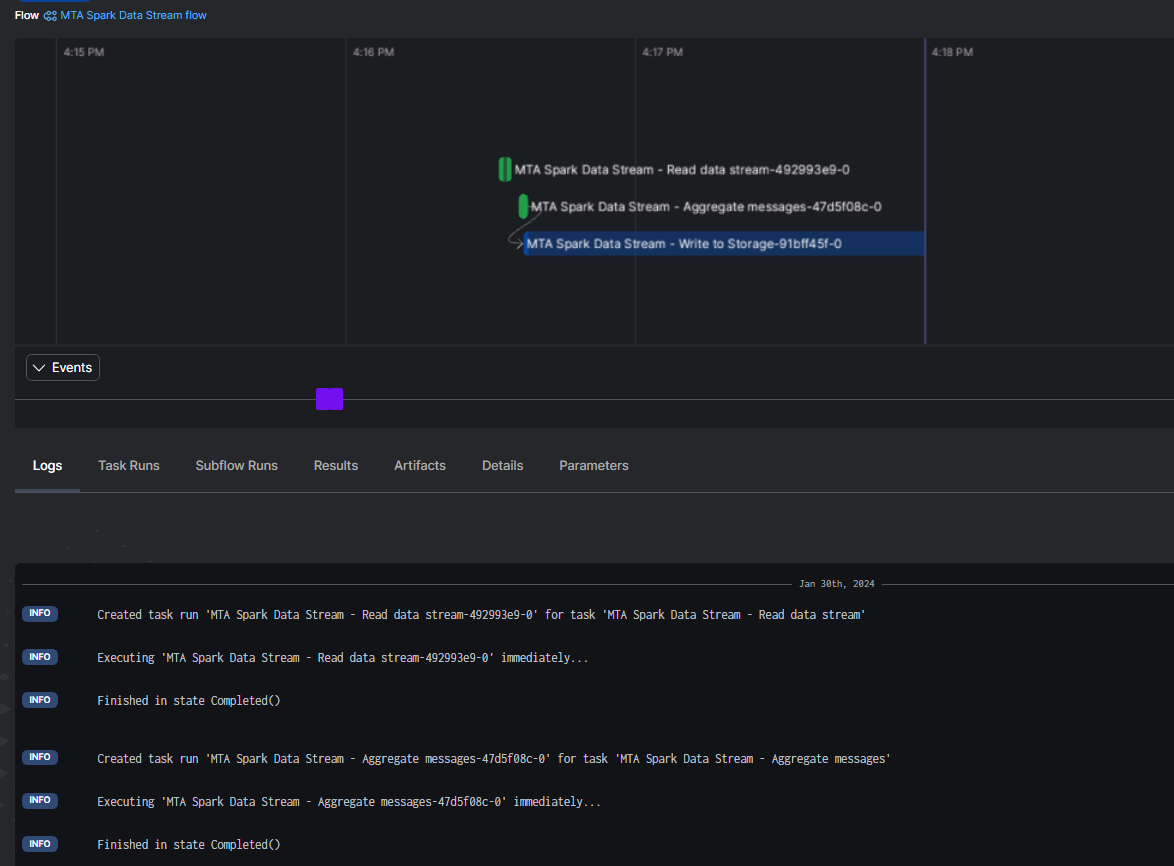
The main_flow function is annotated with @flow and functions as the primary entry point for the flow. This flow configuration enables us to monitor the flow using our Prefect Cloud monitoring system. It takes parameters (topic and config_path) and initializes a Kafka producer using the provided configuration path and topic.

👉 The data generated by this producer uses dummy data. It's important to note that the MTA system lacks a real-time feed for the turnstile data.

Spark - Kafka Consumer

The Spark PySpark application listens to a Kafka topic to retrieve messages. It parses these messages using a predefined schema to define the fields and their types. Since these messages arrive every ten seconds, our goal is to aggregate them within a time-span duration of five minutes. The specific duration can be defined based on solution requirements, and for our purposes, it aligns seamlessly with our current data pipeline flow. The aggregated messages are then serialized into compressed CSV files and loaded into the data lake. Subsequently, the data warehouse incremental process can merge this information into our data warehouse.

Our Spark application comprises the following components:

  • Spark Setting class
  • Spark Consumer class
  • Main Application Entry
    • Prefect libraries for flow monitoring
    • Prefect component for accessing the data lake
    • Access to the data lake

Spark Setting Class


class SparkSettings:
    def __init__(self, config_path: str, topic: str, group_id: str, client_id: str) -> None:
        self.settings = read_config(config_path)

        use_sasl = "sasl.mechanism" in self.settings and self.settings["sasl.mechanism"] is not None

        self.kafka_options = {
            "kafka.bootstrap.servers": self.settings["bootstrap.servers"],
            "subscribe": topic,
            "startingOffsets": "earliest",
            "failOnDataLoss": "false",
            "client.id": client_id,
            "group.id": group_id,            
            "auto.offset.reset": "earliest",
            "checkpointLocation": "checkpoint",
            "minPartitions": "2",
            "enable.auto.commit": "false",
            "enable.partition.eof": "true"                        
        }          

        if use_sasl:
            # set the JAAS configuration only when use_sasl is True
            sasl_config = f'org.apache.kafka.common.security.plain.PlainLoginModule required serviceName="kafka" username="{self.settings["sasl.username"]}" password="{self.settings["sasl.password"]}";'

            login_options = {
                "kafka.sasl.mechanisms": self.settings["sasl.mechanism"],
                "kafka.security.protocol": self.settings["security.protocol"],
                "kafka.sasl.username": self.settings["sasl.username"],
                "kafka.sasl.password": self.settings["sasl.password"],  
                "kafka.sasl.jaas.config": sasl_config          
            }
            # merge the login options with the kafka options
            self.kafka_options = {**self.kafka_options, **login_options}


    def __getitem__(self, key):
        """
            Get the value of a key from the settings dictionary.
        """
        return self.settings[key]

    def set_jass_config(self) -> None:
        """
            Set the JAAS configuration with variables
        """
        jaas_config = (
            "KafkaClient {\n"
            "    org.apache.kafka.common.security.plain.PlainLoginModule required\n"
            f"    username=\"{self['sasl.username']}\"\n"
            f"    password=\"{self['sasl.password']}\";\n"            
            "};"
        )

        print('========ENV===========>',jaas_config)
        # Set the JAAS configuration in the environment
        os.environ['KAFKA_OPTS'] = f"java.security.auth.login.config={jaas_config}"        
        os.environ['java.security.auth.login.config'] = jaas_config

The Spark Setting class manages the configuration for connecting to a Kafka topic and receiving messages within Spark.

Spark Consumer Class

class SparkConsumer:
    def __init__(self, settings: SparkSettings, topic: str, group_id: str, client_id: str):
        self.settings = settings
        self.topic = topic        
        self.group_id = group_id
        self.client_id = client_id
        self.stream = None
        self.data_frame = None   
        self.kafka_options = self.settings.kafka_options     

    def read_kafka_stream(self, spark: SparkSession) -> None:
        """
        Reads the Kafka Topic.
        Args:
            spark (SparkSession): The spark session object.
        """
        self.stream = spark.readStream.format("kafka").options(**self.kafka_options).load()

    def parse_messages(self, schema) -> DataFrame:
        """
        Parse the messages and use the provided schema to type cast the fields
        """
        stream = self.stream

        assert stream.isStreaming is True, "DataFrame doesn't receive streaming data"

        options =  {'header': 'true', 'sep': ','}
        df = stream.selectExpr("CAST(key AS STRING)", "CAST(value AS STRING)", "timestamp")               

        # split attributes to nested array in one Column
        col = F.split(df['value'], ',')

        # expand col to multiple top-level columns
        for idx, field in enumerate(schema):
            df = df.withColumn(field.name, col.getItem(idx).cast(field.dataType))

        # remove quotes from TIMESTAMP column
        df = df.withColumn("TIMESTAMP", F.regexp_replace(F.col("TIMESTAMP"), '"', ''))    
        df = df.withColumn("CA", F.regexp_replace(F.col("CA"), '"', ''))    

        result = df.select([field.name for field in schema])    

        df.dropDuplicates(["ID","STATION","TIMESTAMP"])

        result.printSchema()

        return result

    def agg_messages(self, df: DataFrame,  window_duration: str, window_slide: str) -> DataFrame:
        """
            Window for n minutes aggregations group by by AC, UNIT, STATION, DATE, DESC
        """
       # Ensure TIMESTAMP is in the correct format (timestamp type)    
        date_format = "yyyy-MM-dd HH:mm:ss"        
        df = df.withColumn("TS", F.to_timestamp("TIMESTAMP", date_format))    

        df_windowed = df \
            .withWatermark("TS", window_duration) \
            .groupBy(F.window("TS", window_duration, window_slide),"CA", "UNIT","SCP","STATION","LINENAME","DIVISION", "DATE", "DESC") \
            .agg(
                F.sum("ENTRIES").alias("ENTRIES"),
                F.sum("EXITS").alias("EXITS")
            ).withColumn("START",F.col("window.start")) \
            .withColumn("END", F.col("window.end")) \
            .withColumn("TIME", F.date_format("window.end", "HH:mm:ss")) \
            .drop("window") \
            .select("CA","UNIT","SCP","STATION","LINENAME","DIVISION","DATE","DESC","TIME","START","END","ENTRIES","EXITS")

        df_windowed.printSchema()            

        return df_windowed

The Spark consumer class initiates the consumer by loading the Kafka settings, reading from the data stream, parsing the messages, and ultimately aggregating the information using various categorical fields from the data.

The agg_messages function is crafted to perform windowed aggregations on a DataFrame containing message data. It requires three parameters: df (the input DataFrame with message information), window_duration (specifying the duration of each aggregation window in minutes), and window_slide (indicating the sliding interval for the window). The function ensures the 'TIMESTAMP' column is in the correct timestamp format and applies windowed aggregations based on 'AC', 'UNIT', 'STATION', 'DATE', and 'DESC' columns. The resulting DataFrame includes aggregated entries and exits for each window and group, providing insights into activity patterns over specified time intervals. The function also prints the schema of the resulting DataFrame, making it convenient for users to understand the structure of the aggregated data.

👉 The agg_messages function verifies that the timestamp from the data is in the correct Spark timestamp format. An incorrect format will prevent Spark from aggregating the messages, resulting in empty data files.

Main application entry point

# @task(name="Stream write GCS", description='Write stream file to GCS', log_prints=False)
def stream_write_gcs(local_path: Path, file_name: str) -> None:

    """
        Upload local parquet file to GCS
        Args:
            path: File location
            prefix: the folder location on storage

    """    
    block_name = get_block_name()
    prefix = get_prefix()
    gcs_path = f'{prefix}/{file_name}'
    print(f'{block_name} {local_path} {gcs_path}')

    gcs_block = GcsBucket.load(block_name)        
    gcs_block.upload_from_path(from_path=local_path, to_path=gcs_path)

    return


# @task (name="MTA Spark Data Stream - Process Mini Batch", description="Write batch to the data lake")
def process_mini_batch(df, batch_id, path):
    """Processes a mini-batch, converts to Pandas, and writes to GCP Storage as CSV.gz."""

     # Check if DataFrame is empty
    if df.count() == 0:
        print(f"DataFrame for batch {batch_id} is empty. Skipping processing.")
        return

    # Convert to Pandas DataFrame
    df_pandas = df.toPandas()

    # Convert 'DATE' column to keep the same date format
    df_pandas['DATE'] = pd.to_datetime(df_pandas['DATE'], format='%m-%d-%y').dt.strftime('%m/%d/%Y')

    print(df_pandas.head())

    # Get the current timestamp
    timestamp = datetime.now()
    # Format the timestamp as needed
    time = timestamp.strftime("%Y%m%d_%H%M%S")    

    # Write to Storage as CSV.gz    
    file_name = f"batch_{batch_id}_{time}.csv.gz"
    file_path = f"{path}/{file_name}"
    df_pandas.to_csv(file_path, compression="gzip")

    # send to the data lake
    stream_write_gcs(file_path, file_name)

@task (name="MTA Spark Data Stream - Aggregate messages", description="Aggregate the data in time windows")
def aggregate_messages(consumer, df_messages, window_duration, window_slide) -> DataFrame:
    df_windowed = consumer.agg_messages(df_messages, window_duration, window_slide)
    return df_windowed

@task (name="MTA Spark Data Stream - Read data stream", description="Read the data stream")
def read_data_stream(consumer, spark_session) -> None:
    consumer.read_kafka_stream(spark_session) 

# write a streaming data frame to storage ./storage
@task (name="MTA Spark Data Stream - Write to Storage", description="Write batch to the data lake")
def write_to_storage(df: DataFrame, output_mode: str = 'append', processing_time: str = '60 seconds') -> None:
    """
        Output stream values to the console
    """   
    df_csv = df.select(
        "CA", "UNIT", "SCP", "STATION", "LINENAME", "DIVISION", "DATE", "TIME", "DESC","ENTRIES", "EXITS"
    )

    path = "./storage/"     

    folder_path = Path(path)
    if not os.path.exists(folder_path):
        folder_path.mkdir(parents=True, exist_ok=True)

    storage_query = df_csv.writeStream \
        .outputMode(output_mode) \
        .trigger(processingTime=processing_time) \
        .format("csv") \
        .option("header", True) \
        .option("path", path) \
        .option("checkpointLocation", "./checkpoint") \
        .foreachBatch(lambda batch, id: process_mini_batch(batch, id, path)) \
        .option("truncate", False) \
        .start()

    try:
        # Wait for the streaming query to terminate
        storage_query.awaitTermination()
    except KeyboardInterrupt:
        # Handle keyboard interrupt (e.g., Ctrl+C)
        storage_query.stop()

@flow (name="MTA Spark Data Stream flow", description="Data Streaming Flow")
def main_flow(params) -> None:
    """
    main flow to process stream messages with spark
    """    
    topic = params.topic
    group_id = params.group    
    client_id = params.client
    config_path = params.config    

    # define a window for n minutes aggregations group by station
    default_span = '5 minutes'
    window_duration = default_span if params.duration is None else f'{params.duration} minutes'
    window_slide = default_span if params.slide is None else f'{params.slide} minutes'

    # create the consumer settings
    spark_settings = SparkSettings(config_path, topic, group_id, client_id)    

    # create the spark consumer
    spark_session = SparkSession.builder \
            .appName("turnstiles-consumer") \
            .config("spark.sql.adaptive.enabled", "false") \
            .getOrCreate()                

    spark_session.sparkContext.setLogLevel("WARN")

    # create an instance of the consumer class
    consumer = SparkConsumer(spark_settings, topic, group_id, client_id)

    # set the data frame stream
    read_data_stream(consumer, spark_session)
    # consumer.read_kafka_stream(spark_session) 

    # parse the messages
    df_messages = consumer.parse_messages(schema=turnstiles_schema)    

    df_windowed = aggregate_messages(consumer, df_messages, window_duration, window_slide)
    # df_windowed = consumer.agg_messages(df_messages, window_duration, window_slide)

    write_to_storage(df=df_windowed, output_mode='append',processing_time=window_duration)

    spark_session.streams.awaitAnyTermination()


if __name__ == "__main__":
    """
        Main entry point for streaming data between kafka and spark        
    """
    os.system('clear')
    print('Spark streaming running...')
    parser = argparse.ArgumentParser(description='Producer : --topic mta-turnstile --group spark_group --client app1 --config path-to-config')

    parser.add_argument('--topic', required=True, help='kafka topics')    
    parser.add_argument('--group', required=True, help='consumer group')
    parser.add_argument('--client', required=True, help='client id group')
    parser.add_argument('--config', required=True, help='cloud settings')    
    parser.add_argument('--duration', required=False, help='window duration for aggregation 5 mins')        
    parser.add_argument('--slide', required=False, help='window slide 5 mins')        

    args = parser.parse_args()

    main_flow(args)

    print('end')

This is a summary of the main application to start the consumer application:

  • stream_write_gcs

    • Purpose: Uploads a local Parquet file to Google Cloud Storage (GCS).
    • Prefect Cloud Monitoring: Marked as a Prefect task (@task) for monitoring.
  • process_mini_batch

    • Purpose: Processes a mini-batch from a Spark DataFrame, converts it to a Pandas DataFrame, and writes it to GCP Storage as a compressed CSV file.
    • Prefect Cloud Monitoring: Marked as a Prefect task (@task) for monitoring.
  • aggregate_messages

    • Purpose: Aggregates data in time windows based on specific columns.
    • Prefect Cloud Monitoring: Marked as a Prefect task (@task) for monitoring.
  • read_data_stream

    • Purpose: Reads the data stream from Kafka.
    • Prefect Cloud Monitoring: Marked as a Prefect task (@task) for monitoring.
  • write_to_storage

    • Purpose: Writes a streaming DataFrame to storage (./storage) and triggers the processing of mini-batches.
    • Prefect Cloud Monitoring: Marked as a Prefect task (@task) for monitoring.
  • main_flow

    • Purpose: Defines the main flow to process stream messages with Spark.
    • Prefect Cloud Monitoring: Marked as a Prefect flow (@flow) for orchestration and monitoring.
  • Main Entry Point:

    • Purpose: Parses command-line arguments and invokes the main_flow function to execute the streaming data processing.

👉 These decorators (@flow and @task) are employed for Prefect Cloud Monitoring, orchestration, and task management.

How to runt it!

With all the requirements completed and the code review done, we are ready to run our solution. Let's follow these steps to ensure our apps run properly.

Start the Container Services

Initiate the container services from the command line by executing the following script:

$ bash start_services.sh

Install dependencies and run the apps

👉 These applications depend on the Kafka and Spark services to be running. Ensure to start those services first.

Kafka Producer

Execute the producer with the following command line:

$ bash start_producer.sh

Spark - Kafka Consumer

Execute the Spark consumer from the command line:

$ bash start_consumer.sh

Execution Results

After the producer and consumer are running, the following results should be observed:

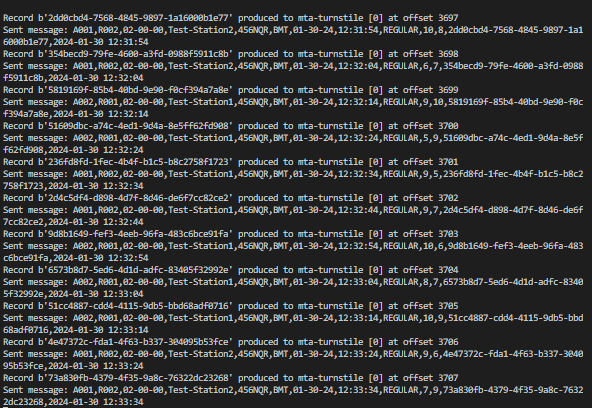
Kafka Producer Log

Data Engineering Process Fundamentals - Data Streaming Kafka Producer Log

As messages are sent by the producer, we should observe the activity in the console or log file.

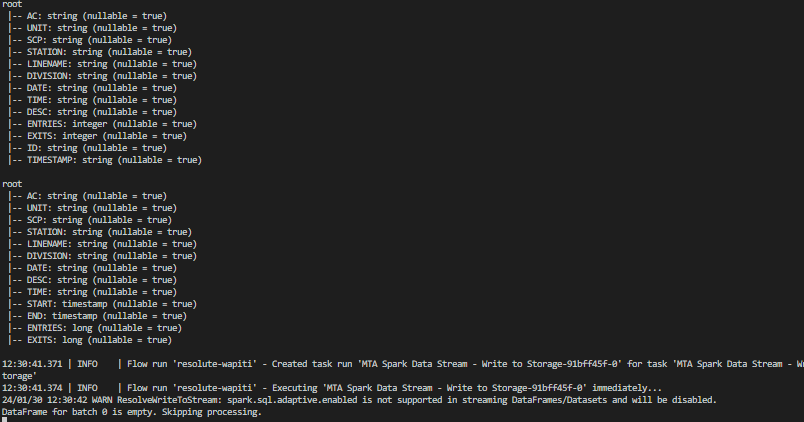
Spark Consumer Log

Data Engineering Process Fundamentals - Data Streaming Spark Consumer Log

Spark parses the messages in real-time, displaying the message schemas for both the individual message from Kafka and the aggregated message. Once the time window is complete, it serializes the message from memory into a compressed CSV file.

Cloud Monitor

Data Engineering Process Fundamentals -  Data Streaming Cloud Monitor

As the application runs, the flows and tasks are tracked on our cloud console. This tracking is utilized to monitor for any failures.

Data Lake Integration

Data Engineering Process Fundamentals -  Data Streaming Data Lake

Upon serializing the data aggregation, a compressed CSV file is uploaded to the data lake with the purpose of making it visible to our data warehouse integration process.

Data Warehouse Integration

Data Engineering Process Fundamentals -  Data Streaming Data Warehouse

Once the data has been transferred to the data lake, we can initiate the integration from the data warehouse. A quick way to check is to query the external table using the test station name.

👉 Our weekly batch process is scheduled once per week. However, in a data stream use case, where the data arrives more frequently, we need to update the schedule to an hourly or minute window.

Deployment

For our deployment process, we can follow these steps:

  • Define the Docker files for each component
  • Build and push the apps to DockerHub
  • Deploy the Kafka and Spark services
  • Deploy the Kafka producer and Spark consumer apps

Define the Docker files for each component

To facilitate each deployment, we aim to run our applications within a Docker container. In each application folder, you'll find a Dockerfile. This file installs the application dependencies, copies the necessary files, and runs the specific command to load the application.

👉 Noteworthy is the use of the VOLUME command in these files, enabling us to map a VM hosting folder to an image folder. The objective is to share a common configuration file for the containers.

  • Kafka Producer Docker file
# Use a base image with Prefect and Python
FROM prefecthq/prefect:2.7.7-python3.9

# Set the working directory
WORKDIR /app

# Copy the requirements file to the working directory
COPY requirements.txt .

# Install dependencies
RUN pip install -r requirements.txt --trusted-host pypi.python.org --no-cache-dir

# Copy the entire current directory into the container
COPY *.py .

# Specify the default command to run when the container starts
CMD ["python3", "program.py", "--topic","mta-turnstile","--config","/config/docker-kafka.properties"]

# Create a directory for Kafka configuration
RUN mkdir -p /config

# Create a volume mount for Kafka configuration
VOLUME ["/config"]

# push the ~/.kafka/docker-kafka.properties to the target machine
# run as to map the volume to the target machine:
# docker run -v ~/.kafka:/config your-image-name
  • Spark Consumer Docker file
# Use a base image with Prefect and Python
FROM prefecthq/prefect:2.7.7-python3.9

# Set the working directory
WORKDIR /app

# Copy the requirements file to the working directory
COPY requirements.txt .

# Install dependencies
RUN pip install -r requirements.txt --trusted-host pypi.python.org --no-cache-dir

# Copy the entire current directory into the container
COPY *.py .
COPY *.sh .

# Create a directory for Kafka configuration
RUN mkdir -p /config

# Create a volume mount for Kafka configuration
VOLUME ["/config"]

# Set the entry point script as executable
RUN chmod +x submit-program.sh

# Specify the default command to run when the container starts
CMD ["/bin/bash", "submit-program.sh", "program.py", "/config/docker-kafka.properties"]

# push the ~/.kafka/docker-kafka.properties to the target machine
# run as to map the volume to the target machine:
# docker run -v ~/.kafka:/config your-image-name

Build and push the apps to DockerHub

To build the apps in Docker containers, execute the following script:

$ bash build_push_apps.sh

Deploy the Kafka and Spark services

For Kafka and Spark services, we are utilizing predefined Bitnami images from DockerHub. Deploy these images by running the following script on the target environment:

$ bash deploy_kafka_spark.sh

This script utilizes a Docker Compose file to pull the Bitnami images and subsequently run them.

👉 Docker Compose is a tool for defining and running multi-container Docker applications. It can define the services, networks, and volumes needed for the application in a single docker-compose.yml file.

Deploy the Kafka producer and Spark consumer apps

Once the app images are available from DockerHub, initiate the deployment against a new environment by executing this script:

$ bash deploy_publisher_consumer_apps.sh

This script pulls the app images from DockerHub and runs them independently.

👉 It's important to note that while we've covered a local and a GitHub Action deployment, deploying on a cloud provider environment involves additional considerations.

Deployment Strategy

In this guide, we've explored a two-fold approach to deploying our Kafka and Spark-based data streaming solution. Initially, we used the manual deployment process, demonstrating how to execute bash scripts for building and deploying our application. This hands-on method provides a detailed understanding of the steps involved, giving users complete control over the deployment process.

Moving forward, we showcased a more streamlined and automated approach by integrating GitHub Actions into our workflow. By leveraging GitHub Actions, we can trigger builds and deployments with a simple push to dedicated branches (deploy-bitnami and deploy-apps). This automation not only simplifies the deployment process but also enhances efficiency, ensuring consistency across environments.

Summary

The integration of Kafka and Spark in a data streaming architecture involves producers publishing data to Kafka topics, consumers subscribing to these topics, Spark consuming data from Kafka, parsing and aggregating messages, and finally, writing the processed data to a data lake or other storage for further processing.

Once the data is available in the data lake, the data warehouse process can pick up the new files and continue its incremental update process, ultimately reflecting on the analysis and visualization layer. This architecture enables real-time data processing and analytics in a scalable and fault-tolerant manner.

Thanks for reading.

Send question or comment at Twitter @ozkary

👍 Originally published by ozkary.com